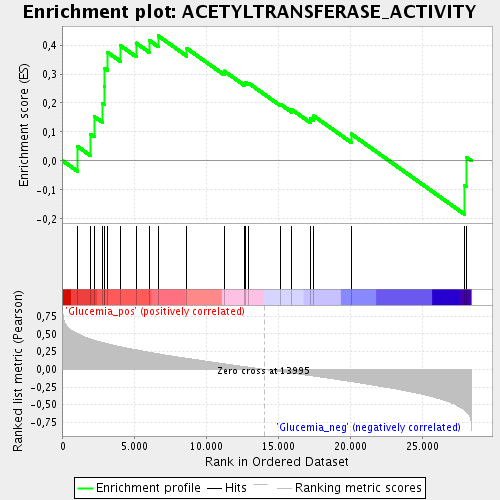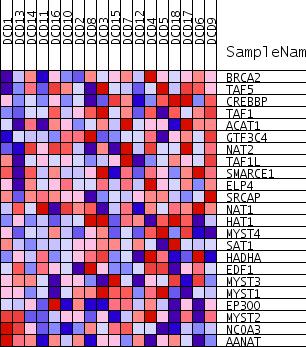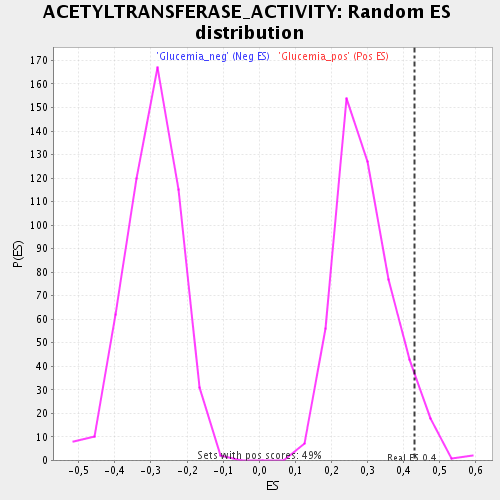
Profile of the Running ES Score & Positions of GeneSet Members on the Rank Ordered List
| Dataset | DCD_collapsed_to_symbols.DCD.cls#Glucemia |
| Phenotype | DCD.cls#Glucemia |
| Upregulated in class | Glucemia_pos |
| GeneSet | ACETYLTRANSFERASE_ACTIVITY |
| Enrichment Score (ES) | 0.43165272 |
| Normalized Enrichment Score (NES) | 1.4709 |
| Nominal p-value | 0.049484536 |
| FDR q-value | 0.15126069 |
| FWER p-Value | 1.0 |

| PROBE | GENE SYMBOL | GENE_TITLE | RANK IN GENE LIST | RANK METRIC SCORE | RUNNING ES | CORE ENRICHMENT | |
|---|---|---|---|---|---|---|---|
| 1 | BRCA2 | 1033 | 0.502 | 0.0495 | Yes | ||
| 2 | TAF5 | 1908 | 0.430 | 0.0924 | Yes | ||
| 3 | CREBBP | 2169 | 0.412 | 0.1538 | Yes | ||
| 4 | TAF1 | 2729 | 0.380 | 0.1991 | Yes | ||
| 5 | ACAT1 | 2889 | 0.372 | 0.2572 | Yes | ||
| 6 | GTF3C4 | 2920 | 0.371 | 0.3196 | Yes | ||
| 7 | NAT2 | 3095 | 0.362 | 0.3754 | Yes | ||
| 8 | TAF1L | 4025 | 0.319 | 0.3973 | Yes | ||
| 9 | SMARCE1 | 5089 | 0.276 | 0.4071 | Yes | ||
| 10 | ELP4 | 5991 | 0.242 | 0.4168 | Yes | ||
| 11 | SRCAP | 6634 | 0.219 | 0.4317 | Yes | ||
| 12 | NAT1 | 8624 | 0.155 | 0.3882 | No | ||
| 13 | HAT1 | 11213 | 0.078 | 0.3105 | No | ||
| 14 | MYST4 | 12652 | 0.038 | 0.2664 | No | ||
| 15 | SAT1 | 12710 | 0.036 | 0.2706 | No | ||
| 16 | HADHA | 12931 | 0.030 | 0.2680 | No | ||
| 17 | EDF1 | 15119 | -0.032 | 0.1964 | No | ||
| 18 | MYST3 | 15916 | -0.054 | 0.1776 | No | ||
| 19 | MYST1 | 17226 | -0.089 | 0.1468 | No | ||
| 20 | EP300 | 17453 | -0.096 | 0.1552 | No | ||
| 21 | MYST2 | 20059 | -0.173 | 0.0932 | No | ||
| 22 | NCOA3 | 27963 | -0.581 | -0.0855 | No | ||
| 23 | AANAT | 28057 | -0.595 | 0.0130 | No |

