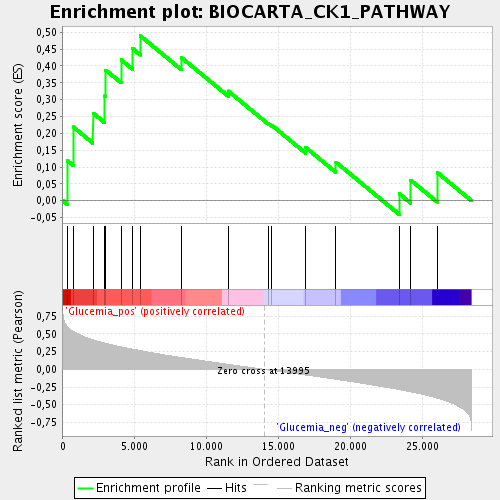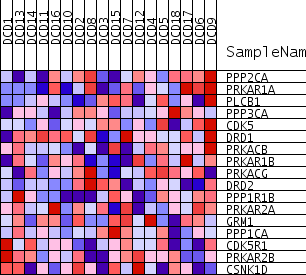
Profile of the Running ES Score & Positions of GeneSet Members on the Rank Ordered List
| Dataset | DCD_collapsed_to_symbols.DCD.cls#Glucemia |
| Phenotype | DCD.cls#Glucemia |
| Upregulated in class | Glucemia_pos |
| GeneSet | BIOCARTA_CK1_PATHWAY |
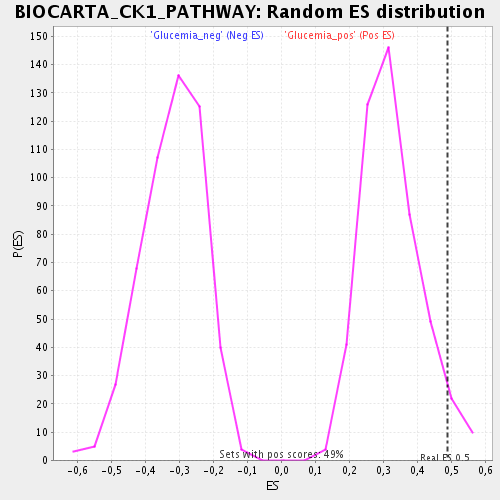
| Enrichment Score (ES) | 0.48930347 |
| Normalized Enrichment Score (NES) | 1.5105741 |
| Nominal p-value | 0.039175257 |
| FDR q-value | 0.12861729 |
| FWER p-Value | 1.0 |

| PROBE | GENE SYMBOL | GENE_TITLE | RANK IN GENE LIST | RANK METRIC SCORE | RUNNING ES | CORE ENRICHMENT | |
|---|---|---|---|---|---|---|---|
| 1 | PPP2CA | 300 | 0.605 | 0.1193 | Yes | ||
| 2 | PRKAR1A | 718 | 0.533 | 0.2191 | Yes | ||
| 3 | PLCB1 | 2090 | 0.418 | 0.2605 | Yes | ||
| 4 | PPP3CA | 2918 | 0.371 | 0.3110 | Yes | ||
| 5 | CDK5 | 2983 | 0.367 | 0.3876 | Yes | ||
| 6 | DRD1 | 4053 | 0.317 | 0.4181 | Yes | ||
| 7 | PRKACB | 4837 | 0.286 | 0.4519 | Yes | ||
| 8 | PRKAR1B | 5389 | 0.265 | 0.4893 | Yes | ||
| 9 | PRKACG | 8225 | 0.168 | 0.4255 | No | ||
| 10 | DRD2 | 11491 | 0.071 | 0.3258 | No | ||
| 11 | PPP1R1B | 14326 | -0.010 | 0.2281 | No | ||
| 12 | PRKAR2A | 14510 | -0.015 | 0.2248 | No | ||
| 13 | GRM1 | 16891 | -0.080 | 0.1582 | No | ||
| 14 | PPP1CA | 18992 | -0.141 | 0.1146 | No | ||
| 15 | CDK5R1 | 23407 | -0.287 | 0.0208 | No | ||
| 16 | PRKAR2B | 24193 | -0.317 | 0.0613 | No | ||
| 17 | CSNK1D | 26041 | -0.409 | 0.0840 | No |

