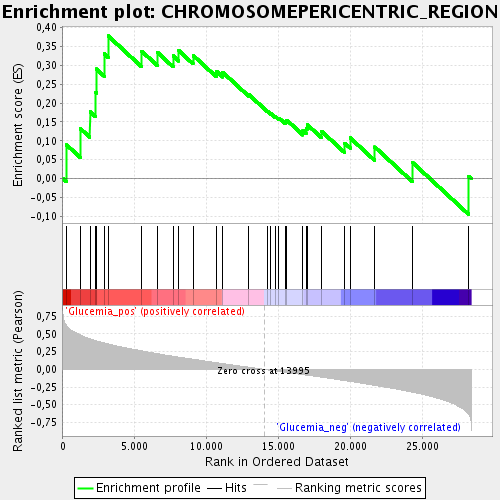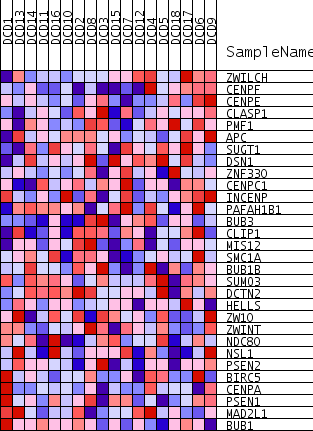
Profile of the Running ES Score & Positions of GeneSet Members on the Rank Ordered List
| Dataset | DCD_collapsed_to_symbols.DCD.cls#Glucemia |
| Phenotype | DCD.cls#Glucemia |
| Upregulated in class | Glucemia_pos |
| GeneSet | CHROMOSOMEPERICENTRIC_REGION |
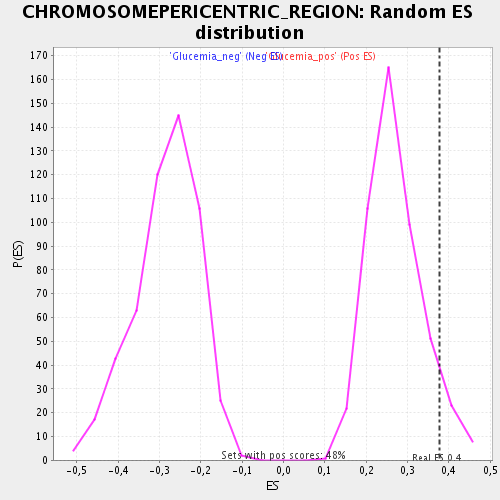
| Enrichment Score (ES) | 0.37813053 |
| Normalized Enrichment Score (NES) | 1.4015005 |
| Nominal p-value | 0.06736842 |
| FDR q-value | 0.20200886 |
| FWER p-Value | 1.0 |

| PROBE | GENE SYMBOL | GENE_TITLE | RANK IN GENE LIST | RANK METRIC SCORE | RUNNING ES | CORE ENRICHMENT | |
|---|---|---|---|---|---|---|---|
| 1 | ZWILCH | 251 | 0.617 | 0.0892 | Yes | ||
| 2 | CENPF | 1220 | 0.484 | 0.1321 | Yes | ||
| 3 | CENPE | 1881 | 0.432 | 0.1775 | Yes | ||
| 4 | CLASP1 | 2286 | 0.405 | 0.2277 | Yes | ||
| 5 | PMF1 | 2321 | 0.403 | 0.2906 | Yes | ||
| 6 | APC | 2867 | 0.373 | 0.3307 | Yes | ||
| 7 | SUGT1 | 3144 | 0.359 | 0.3781 | Yes | ||
| 8 | DSN1 | 5467 | 0.262 | 0.3380 | No | ||
| 9 | ZNF330 | 6558 | 0.222 | 0.3349 | No | ||
| 10 | CENPC1 | 7665 | 0.185 | 0.3253 | No | ||
| 11 | INCENP | 8062 | 0.173 | 0.3388 | No | ||
| 12 | PAFAH1B1 | 9052 | 0.142 | 0.3266 | No | ||
| 13 | BUB3 | 10669 | 0.094 | 0.2846 | No | ||
| 14 | CLIP1 | 11111 | 0.081 | 0.2819 | No | ||
| 15 | MIS12 | 12912 | 0.031 | 0.2234 | No | ||
| 16 | SMC1A | 14219 | -0.007 | 0.1784 | No | ||
| 17 | BUB1B | 14467 | -0.013 | 0.1718 | No | ||
| 18 | SUMO3 | 14778 | -0.022 | 0.1645 | No | ||
| 19 | DCTN2 | 15024 | -0.029 | 0.1604 | No | ||
| 20 | HELLS | 15474 | -0.042 | 0.1512 | No | ||
| 21 | ZW10 | 15571 | -0.044 | 0.1549 | No | ||
| 22 | ZWINT | 16695 | -0.075 | 0.1273 | No | ||
| 23 | NDC80 | 16916 | -0.081 | 0.1325 | No | ||
| 24 | NSL1 | 16984 | -0.083 | 0.1433 | No | ||
| 25 | PSEN2 | 17985 | -0.110 | 0.1256 | No | ||
| 26 | BIRC5 | 19611 | -0.160 | 0.0938 | No | ||
| 27 | CENPA | 19982 | -0.171 | 0.1079 | No | ||
| 28 | PSEN1 | 21692 | -0.226 | 0.0837 | No | ||
| 29 | MAD2L1 | 24318 | -0.322 | 0.0426 | No | ||
| 30 | BUB1 | 28237 | -0.642 | 0.0067 | No |

