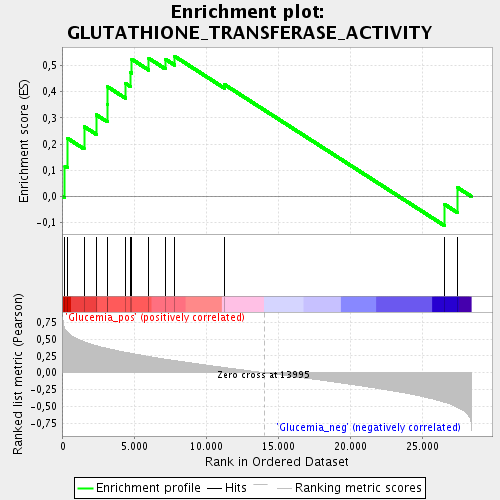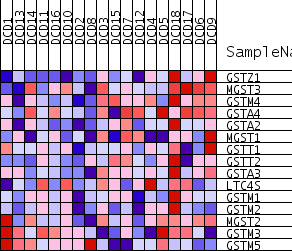
Profile of the Running ES Score & Positions of GeneSet Members on the Rank Ordered List
| Dataset | DCD_collapsed_to_symbols.DCD.cls#Glucemia |
| Phenotype | DCD.cls#Glucemia |
| Upregulated in class | Glucemia_pos |
| GeneSet | GLUTATHIONE_TRANSFERASE_ACTIVITY |
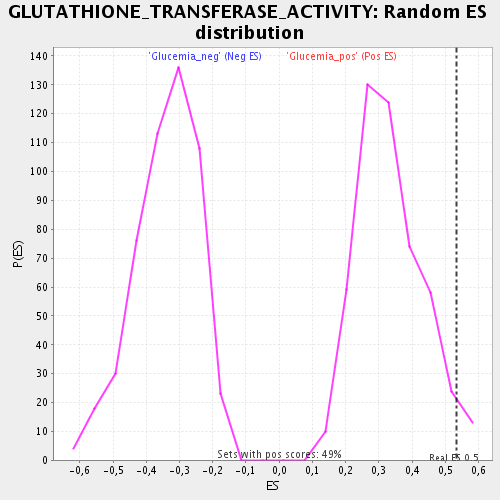
| Enrichment Score (ES) | 0.5348709 |
| Normalized Enrichment Score (NES) | 1.610164 |
| Nominal p-value | 0.034552846 |
| FDR q-value | 0.08537421 |
| FWER p-Value | 1.0 |

| PROBE | GENE SYMBOL | GENE_TITLE | RANK IN GENE LIST | RANK METRIC SCORE | RUNNING ES | CORE ENRICHMENT | |
|---|---|---|---|---|---|---|---|
| 1 | GSTZ1 | 140 | 0.652 | 0.1161 | Yes | ||
| 2 | MGST3 | 302 | 0.605 | 0.2228 | Yes | ||
| 3 | GSTM4 | 1469 | 0.461 | 0.2672 | Yes | ||
| 4 | GSTA4 | 2323 | 0.403 | 0.3120 | Yes | ||
| 5 | GSTA2 | 3081 | 0.362 | 0.3527 | Yes | ||
| 6 | MGST1 | 3100 | 0.361 | 0.4191 | Yes | ||
| 7 | GSTT1 | 4360 | 0.305 | 0.4314 | Yes | ||
| 8 | GSTT2 | 4682 | 0.293 | 0.4744 | Yes | ||
| 9 | GSTA3 | 4795 | 0.287 | 0.5238 | Yes | ||
| 10 | LTC4S | 5978 | 0.242 | 0.5272 | Yes | ||
| 11 | GSTM1 | 7127 | 0.201 | 0.5242 | Yes | ||
| 12 | GSTM2 | 7781 | 0.181 | 0.5349 | Yes | ||
| 13 | MGST2 | 11248 | 0.077 | 0.4272 | No | ||
| 14 | GSTM3 | 26567 | -0.440 | -0.0303 | No | ||
| 15 | GSTM5 | 27452 | -0.515 | 0.0343 | No |

