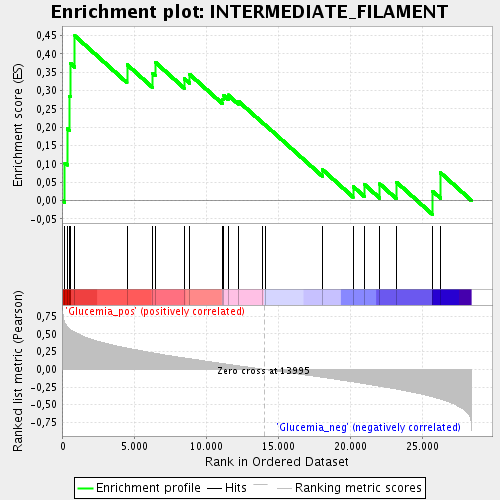
Profile of the Running ES Score & Positions of GeneSet Members on the Rank Ordered List
| Dataset | DCD_collapsed_to_symbols.DCD.cls#Glucemia |
| Phenotype | DCD.cls#Glucemia |
| Upregulated in class | Glucemia_pos |
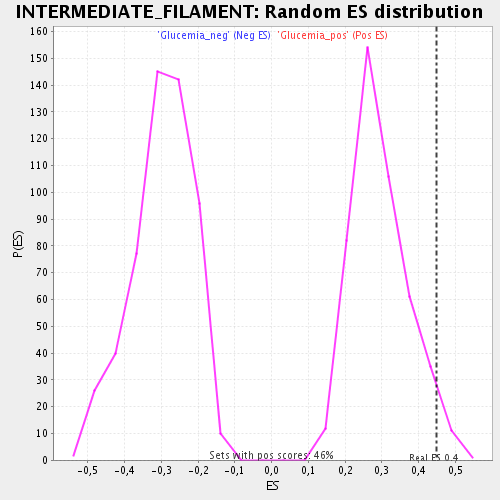
| GeneSet | INTERMEDIATE_FILAMENT |
| Enrichment Score (ES) | 0.4489242 |
| Normalized Enrichment Score (NES) | 1.5210459 |
| Nominal p-value | 0.028138528 |
| FDR q-value | 0.12311342 |
| FWER p-Value | 1.0 |
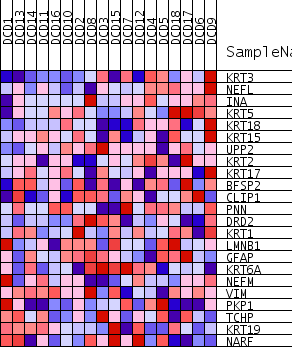
| PROBE | GENE SYMBOL | GENE_TITLE | RANK IN GENE LIST | RANK METRIC SCORE | RUNNING ES | CORE ENRICHMENT | |
|---|---|---|---|---|---|---|---|
| 1 | KRT3 | 137 | 0.653 | 0.1024 | Yes | ||
| 2 | NEFL | 293 | 0.607 | 0.1966 | Yes | ||
| 3 | INA | 459 | 0.570 | 0.2844 | Yes | ||
| 4 | KRT5 | 515 | 0.559 | 0.3743 | Yes | ||
| 5 | KRT18 | 831 | 0.522 | 0.4489 | Yes | ||
| 6 | KRT15 | 4457 | 0.301 | 0.3708 | No | ||
| 7 | UPP2 | 6226 | 0.233 | 0.3468 | No | ||
| 8 | KRT2 | 6415 | 0.227 | 0.3775 | No | ||
| 9 | KRT17 | 8430 | 0.161 | 0.3331 | No | ||
| 10 | BFSP2 | 8828 | 0.149 | 0.3437 | No | ||
| 11 | CLIP1 | 11111 | 0.081 | 0.2766 | No | ||
| 12 | PNN | 11178 | 0.079 | 0.2873 | No | ||
| 13 | DRD2 | 11491 | 0.071 | 0.2879 | No | ||
| 14 | KRT1 | 12196 | 0.050 | 0.2713 | No | ||
| 15 | LMNB1 | 13891 | 0.003 | 0.2121 | No | ||
| 16 | GFAP | 14109 | -0.003 | 0.2050 | No | ||
| 17 | KRT6A | 18049 | -0.112 | 0.0847 | No | ||
| 18 | NEFM | 20183 | -0.177 | 0.0387 | No | ||
| 19 | VIM | 20972 | -0.202 | 0.0442 | No | ||
| 20 | PKP1 | 22045 | -0.238 | 0.0455 | No | ||
| 21 | TCHP | 23205 | -0.278 | 0.0505 | No | ||
| 22 | KRT19 | 25718 | -0.389 | 0.0260 | No | ||
| 23 | NARF | 26269 | -0.422 | 0.0760 | No |