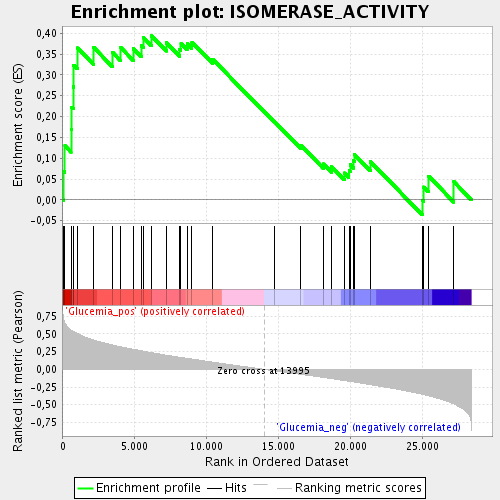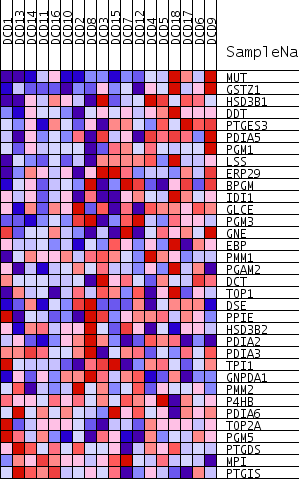
Profile of the Running ES Score & Positions of GeneSet Members on the Rank Ordered List
| Dataset | DCD_collapsed_to_symbols.DCD.cls#Glucemia |
| Phenotype | DCD.cls#Glucemia |
| Upregulated in class | Glucemia_pos |
| GeneSet | ISOMERASE_ACTIVITY |
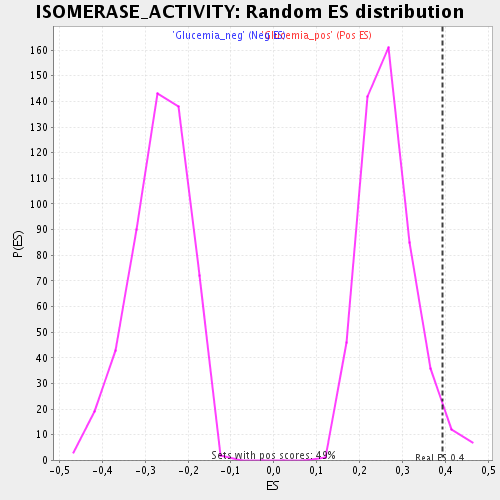
| Enrichment Score (ES) | 0.3939232 |
| Normalized Enrichment Score (NES) | 1.4815837 |
| Nominal p-value | 0.036734693 |
| FDR q-value | 0.14463325 |
| FWER p-Value | 1.0 |

| PROBE | GENE SYMBOL | GENE_TITLE | RANK IN GENE LIST | RANK METRIC SCORE | RUNNING ES | CORE ENRICHMENT | |
|---|---|---|---|---|---|---|---|
| 1 | MUT | 51 | 0.701 | 0.0679 | Yes | ||
| 2 | GSTZ1 | 140 | 0.652 | 0.1296 | Yes | ||
| 3 | HSD3B1 | 562 | 0.552 | 0.1697 | Yes | ||
| 4 | DDT | 599 | 0.547 | 0.2229 | Yes | ||
| 5 | PTGES3 | 721 | 0.533 | 0.2716 | Yes | ||
| 6 | PDIA5 | 752 | 0.530 | 0.3232 | Yes | ||
| 7 | PGM1 | 994 | 0.505 | 0.3649 | Yes | ||
| 8 | LSS | 2133 | 0.415 | 0.3661 | Yes | ||
| 9 | ERP29 | 3428 | 0.345 | 0.3548 | Yes | ||
| 10 | BPGM | 4030 | 0.319 | 0.3654 | Yes | ||
| 11 | IDI1 | 4886 | 0.284 | 0.3635 | Yes | ||
| 12 | GLCE | 5443 | 0.262 | 0.3700 | Yes | ||
| 13 | PGM3 | 5584 | 0.258 | 0.3906 | Yes | ||
| 14 | GNE | 6157 | 0.236 | 0.3939 | Yes | ||
| 15 | EBP | 7193 | 0.200 | 0.3773 | No | ||
| 16 | PMM1 | 8126 | 0.171 | 0.3615 | No | ||
| 17 | PGAM2 | 8211 | 0.168 | 0.3753 | No | ||
| 18 | DCT | 8636 | 0.155 | 0.3758 | No | ||
| 19 | TOP1 | 8974 | 0.145 | 0.3783 | No | ||
| 20 | DSE | 10426 | 0.100 | 0.3372 | No | ||
| 21 | PPIE | 14693 | -0.020 | 0.1890 | No | ||
| 22 | HSD3B2 | 16556 | -0.071 | 0.1305 | No | ||
| 23 | PDIA2 | 18136 | -0.114 | 0.0862 | No | ||
| 24 | PDIA3 | 18698 | -0.131 | 0.0795 | No | ||
| 25 | TPI1 | 19573 | -0.159 | 0.0645 | No | ||
| 26 | GNPDA1 | 19900 | -0.169 | 0.0698 | No | ||
| 27 | PMM2 | 19977 | -0.171 | 0.0842 | No | ||
| 28 | P4HB | 20202 | -0.177 | 0.0939 | No | ||
| 29 | PDIA6 | 20284 | -0.179 | 0.1089 | No | ||
| 30 | TOP2A | 21373 | -0.215 | 0.0920 | No | ||
| 31 | PGM5 | 24990 | -0.351 | -0.0005 | No | ||
| 32 | PTGDS | 25109 | -0.357 | 0.0309 | No | ||
| 33 | MPI | 25430 | -0.375 | 0.0569 | No | ||
| 34 | PTGIS | 27199 | -0.489 | 0.0432 | No |

