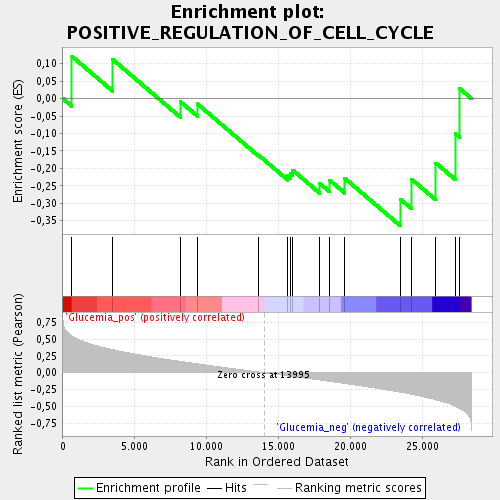
Profile of the Running ES Score & Positions of GeneSet Members on the Rank Ordered List
| Dataset | DCD_collapsed_to_symbols.DCD.cls#Glucemia |
| Phenotype | DCD.cls#Glucemia |
| Upregulated in class | Glucemia_neg |
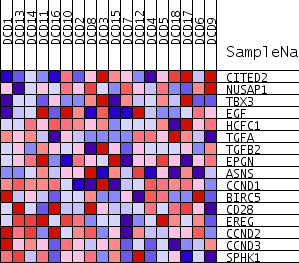
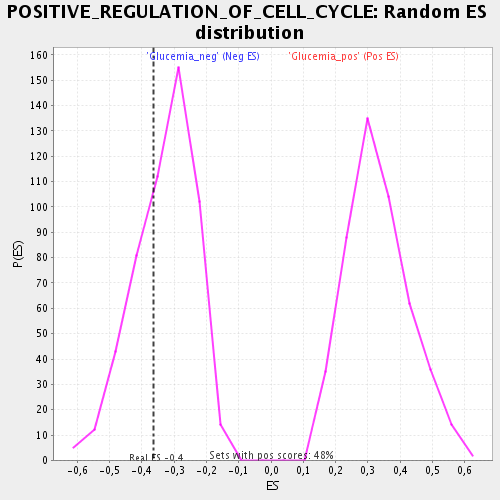
| GeneSet | POSITIVE_REGULATION_OF_CELL_CYCLE |
| Enrichment Score (ES) | -0.3649353 |
| Normalized Enrichment Score (NES) | -1.1070217 |
| Nominal p-value | 0.3244275 |
| FDR q-value | 0.79290813 |
| FWER p-Value | 1.0 |
| PROBE | GENE SYMBOL | GENE_TITLE | RANK IN GENE LIST | RANK METRIC SCORE | RUNNING ES | CORE ENRICHMENT | |
|---|---|---|---|---|---|---|---|
| 1 | CITED2 | 627 | 0.544 | 0.1213 | No | ||
| 2 | NUSAP1 | 3462 | 0.344 | 0.1124 | No | ||
| 3 | TBX3 | 8157 | 0.170 | -0.0081 | No | ||
| 4 | EGF | 9355 | 0.133 | -0.0150 | No | ||
| 5 | HCFC1 | 13605 | 0.011 | -0.1618 | No | ||
| 6 | TGFA | 15642 | -0.046 | -0.2213 | No | ||
| 7 | TGFB2 | 15828 | -0.051 | -0.2142 | No | ||
| 8 | EPGN | 15973 | -0.055 | -0.2047 | No | ||
| 9 | ASNS | 17876 | -0.107 | -0.2433 | No | ||
| 10 | CCND1 | 18562 | -0.127 | -0.2340 | No | ||
| 11 | BIRC5 | 19611 | -0.160 | -0.2287 | No | ||
| 12 | CD28 | 23483 | -0.290 | -0.2885 | Yes | ||
| 13 | EREG | 24269 | -0.321 | -0.2316 | Yes | ||
| 14 | CCND2 | 25943 | -0.402 | -0.1846 | Yes | ||
| 15 | CCND3 | 27316 | -0.500 | -0.1011 | Yes | ||
| 16 | SPHK1 | 27592 | -0.531 | 0.0294 | Yes |