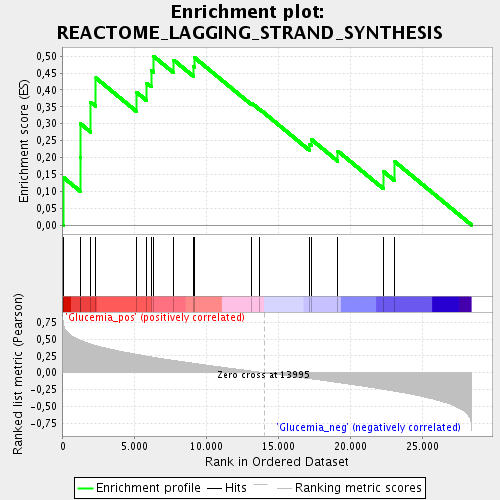
Profile of the Running ES Score & Positions of GeneSet Members on the Rank Ordered List
| Dataset | DCD_collapsed_to_symbols.DCD.cls#Glucemia |
| Phenotype | DCD.cls#Glucemia |
| Upregulated in class | Glucemia_pos |
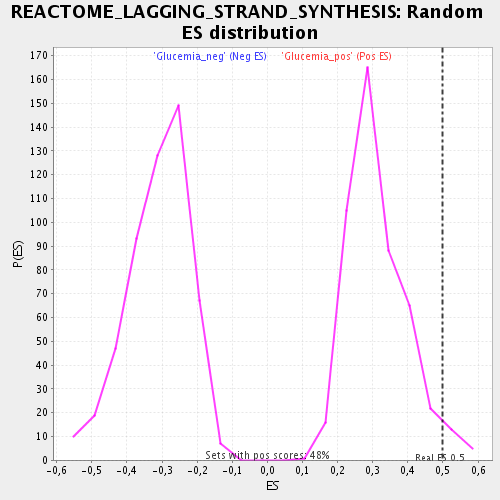
| GeneSet | REACTOME_LAGGING_STRAND_SYNTHESIS |
| Enrichment Score (ES) | 0.4994372 |
| Normalized Enrichment Score (NES) | 1.6014974 |
| Nominal p-value | 0.033333335 |
| FDR q-value | 0.088269554 |
| FWER p-Value | 1.0 |
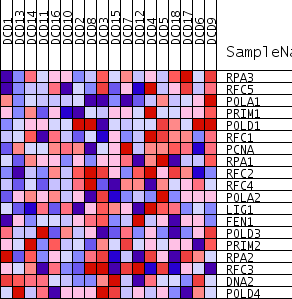
| PROBE | GENE SYMBOL | GENE_TITLE | RANK IN GENE LIST | RANK METRIC SCORE | RUNNING ES | CORE ENRICHMENT | |
|---|---|---|---|---|---|---|---|
| 1 | RPA3 | 70 | 0.685 | 0.1398 | Yes | ||
| 2 | RFC5 | 1194 | 0.487 | 0.2013 | Yes | ||
| 3 | POLA1 | 1242 | 0.481 | 0.2995 | Yes | ||
| 4 | PRIM1 | 1933 | 0.429 | 0.3643 | Yes | ||
| 5 | POLD1 | 2297 | 0.405 | 0.4355 | Yes | ||
| 6 | RFC1 | 5144 | 0.274 | 0.3923 | Yes | ||
| 7 | PCNA | 5819 | 0.248 | 0.4201 | Yes | ||
| 8 | RPA1 | 6138 | 0.236 | 0.4579 | Yes | ||
| 9 | RFC2 | 6316 | 0.230 | 0.4994 | Yes | ||
| 10 | RFC4 | 7714 | 0.183 | 0.4883 | No | ||
| 11 | POLA2 | 9104 | 0.141 | 0.4686 | No | ||
| 12 | LIG1 | 9146 | 0.139 | 0.4961 | No | ||
| 13 | FEN1 | 13134 | 0.024 | 0.3608 | No | ||
| 14 | POLD3 | 13705 | 0.008 | 0.3424 | No | ||
| 15 | PRIM2 | 17173 | -0.088 | 0.2386 | No | ||
| 16 | RPA2 | 17293 | -0.091 | 0.2533 | No | ||
| 17 | RFC3 | 19122 | -0.145 | 0.2191 | No | ||
| 18 | DNA2 | 22311 | -0.247 | 0.1583 | No | ||
| 19 | POLD4 | 23096 | -0.274 | 0.1877 | No |