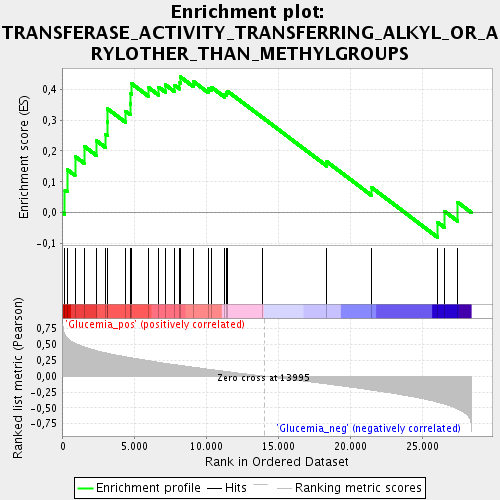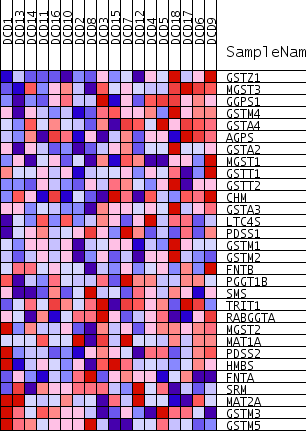
Profile of the Running ES Score & Positions of GeneSet Members on the Rank Ordered List
| Dataset | DCD_collapsed_to_symbols.DCD.cls#Glucemia |
| Phenotype | DCD.cls#Glucemia |
| Upregulated in class | Glucemia_pos |
| GeneSet | TRANSFERASE_ACTIVITY_TRANSFERRING_ALKYL_OR_ARYLOTHER_THAN_METHYLGROUPS |
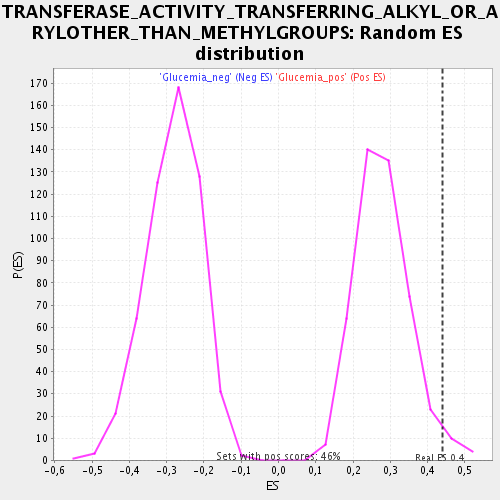
| Enrichment Score (ES) | 0.4399782 |
| Normalized Enrichment Score (NES) | 1.5730599 |
| Nominal p-value | 0.02844639 |
| FDR q-value | 0.09876112 |
| FWER p-Value | 1.0 |

| PROBE | GENE SYMBOL | GENE_TITLE | RANK IN GENE LIST | RANK METRIC SCORE | RUNNING ES | CORE ENRICHMENT | |
|---|---|---|---|---|---|---|---|
| 1 | GSTZ1 | 140 | 0.652 | 0.0729 | Yes | ||
| 2 | MGST3 | 302 | 0.605 | 0.1395 | Yes | ||
| 3 | GGPS1 | 841 | 0.521 | 0.1827 | Yes | ||
| 4 | GSTM4 | 1469 | 0.461 | 0.2156 | Yes | ||
| 5 | GSTA4 | 2323 | 0.403 | 0.2337 | Yes | ||
| 6 | AGPS | 2986 | 0.367 | 0.2542 | Yes | ||
| 7 | GSTA2 | 3081 | 0.362 | 0.2941 | Yes | ||
| 8 | MGST1 | 3100 | 0.361 | 0.3366 | Yes | ||
| 9 | GSTT1 | 4360 | 0.305 | 0.3287 | Yes | ||
| 10 | GSTT2 | 4682 | 0.293 | 0.3523 | Yes | ||
| 11 | CHM | 4726 | 0.291 | 0.3855 | Yes | ||
| 12 | GSTA3 | 4795 | 0.287 | 0.4174 | Yes | ||
| 13 | LTC4S | 5978 | 0.242 | 0.4047 | Yes | ||
| 14 | PDSS1 | 6673 | 0.218 | 0.4063 | Yes | ||
| 15 | GSTM1 | 7127 | 0.201 | 0.4144 | Yes | ||
| 16 | GSTM2 | 7781 | 0.181 | 0.4130 | Yes | ||
| 17 | FNTB | 8136 | 0.170 | 0.4209 | Yes | ||
| 18 | PGGT1B | 8169 | 0.169 | 0.4400 | Yes | ||
| 19 | SMS | 9092 | 0.141 | 0.4244 | No | ||
| 20 | TRIT1 | 10104 | 0.111 | 0.4019 | No | ||
| 21 | RABGGTA | 10310 | 0.104 | 0.4071 | No | ||
| 22 | MGST2 | 11248 | 0.077 | 0.3833 | No | ||
| 23 | MAT1A | 11366 | 0.074 | 0.3880 | No | ||
| 24 | PDSS2 | 11449 | 0.072 | 0.3937 | No | ||
| 25 | HMBS | 13857 | 0.004 | 0.3093 | No | ||
| 26 | FNTA | 18360 | -0.122 | 0.1653 | No | ||
| 27 | SRM | 21447 | -0.218 | 0.0827 | No | ||
| 28 | MAT2A | 26054 | -0.409 | -0.0306 | No | ||
| 29 | GSTM3 | 26567 | -0.440 | 0.0039 | No | ||
| 30 | GSTM5 | 27452 | -0.515 | 0.0343 | No |

