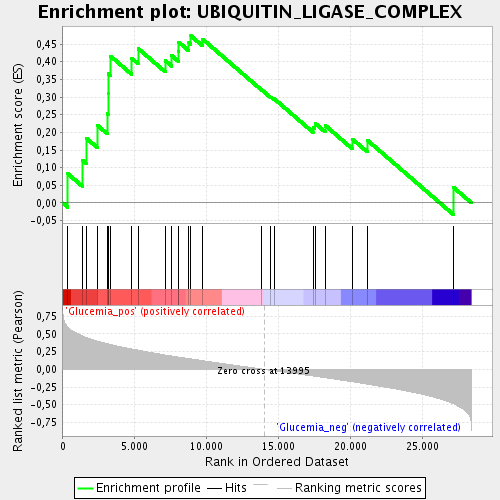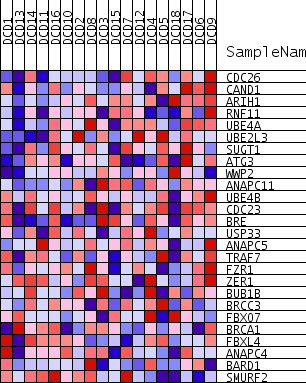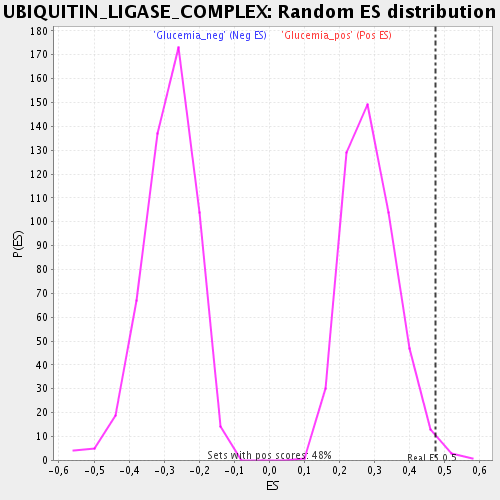
Profile of the Running ES Score & Positions of GeneSet Members on the Rank Ordered List
| Dataset | DCD_collapsed_to_symbols.DCD.cls#Glucemia |
| Phenotype | DCD.cls#Glucemia |
| Upregulated in class | Glucemia_pos |
| GeneSet | UBIQUITIN_LIGASE_COMPLEX |
| Enrichment Score (ES) | 0.47329763 |
| Normalized Enrichment Score (NES) | 1.6455263 |
| Nominal p-value | 0.012578616 |
| FDR q-value | 0.072146825 |
| FWER p-Value | 1.0 |

| PROBE | GENE SYMBOL | GENE_TITLE | RANK IN GENE LIST | RANK METRIC SCORE | RUNNING ES | CORE ENRICHMENT | |
|---|---|---|---|---|---|---|---|
| 1 | CDC26 | 344 | 0.595 | 0.0826 | Yes | ||
| 2 | CAND1 | 1379 | 0.469 | 0.1209 | Yes | ||
| 3 | ARIH1 | 1637 | 0.448 | 0.1832 | Yes | ||
| 4 | RNF11 | 2391 | 0.399 | 0.2202 | Yes | ||
| 5 | UBE4A | 3084 | 0.362 | 0.2535 | Yes | ||
| 6 | UBE2L3 | 3140 | 0.360 | 0.3089 | Yes | ||
| 7 | SUGT1 | 3144 | 0.359 | 0.3660 | Yes | ||
| 8 | ATG3 | 3314 | 0.351 | 0.4159 | Yes | ||
| 9 | WWP2 | 4774 | 0.288 | 0.4105 | Yes | ||
| 10 | ANAPC11 | 5225 | 0.271 | 0.4378 | Yes | ||
| 11 | UBE4B | 7117 | 0.202 | 0.4034 | Yes | ||
| 12 | CDC23 | 7562 | 0.188 | 0.4177 | Yes | ||
| 13 | BRE | 8019 | 0.174 | 0.4293 | Yes | ||
| 14 | USP33 | 8049 | 0.173 | 0.4559 | Yes | ||
| 15 | ANAPC5 | 8764 | 0.151 | 0.4548 | Yes | ||
| 16 | TRAF7 | 8904 | 0.147 | 0.4733 | Yes | ||
| 17 | FZR1 | 9718 | 0.122 | 0.4641 | No | ||
| 18 | ZER1 | 13781 | 0.006 | 0.3220 | No | ||
| 19 | BUB1B | 14467 | -0.013 | 0.3000 | No | ||
| 20 | BRCC3 | 14694 | -0.020 | 0.2953 | No | ||
| 21 | FBXO7 | 17400 | -0.094 | 0.2150 | No | ||
| 22 | BRCA1 | 17535 | -0.098 | 0.2259 | No | ||
| 23 | FBXL4 | 18237 | -0.118 | 0.2200 | No | ||
| 24 | ANAPC4 | 20141 | -0.176 | 0.1810 | No | ||
| 25 | BARD1 | 21181 | -0.209 | 0.1777 | No | ||
| 26 | SMURF2 | 27163 | -0.486 | 0.0445 | No |

