


Relative Quantification normalized to a Reference GeneCurrently, relative quantification is applied to know wether the expression of specific genes differes between two groups, for example: sick group vs control group.Before relative quantification, Real-time RT-PCR raw data has to be normalized. Appropiate normalization strategies are required in order to control experimental errors introduced during the multistage process required to extract and process the RNA. Two different normalization methods are accepted in relative quantification:
Reference geneInternal control or reference gene should present a constant expression in all samples tested and this expression should not change in different conditions of study or in response to experimental treatment. Nevertheless literature shows that reference gene expression can vary considerably between samples, that's why for identify the best reference gene CT tool apply the Vandesompele method, which identify the best internal control gene based on their stability. Furthermore, it's possible to select more than one reference gene, in this case the algorithm identify genes with best stability values and then makes the geometric mean.Relative quantificationOnce a reference gene is selected tool proceedes to relative quantification.To calculate the relative expression to a reference gene, there are described three different methods: 2-ΔΔCT Method, 2-ΔCT Method and Pfaffl Method. CT tool uses a mathematical formula derived from Pfaffl Method for the relative quantification (this formula is similar to mathematical method presented by Soong et al. -Roche Diagnostics (2000)-). The mathematical algorithm derived from Pfaffl method used in CT tool is defined as: 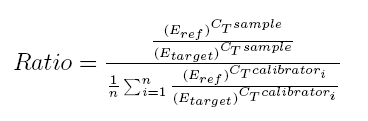 Real-time RT-PCR efficiencyGenerally, a PCR consists of four different kinetic stages, which are basically similar to the well-known bacterial growth kinetics as observed by Monod. In second stage it takes place a logaritmic phase, the exponential growth of PCR product --ideally, there is a doubling od PCR product every cycle-- that is measurable as fluorescent signal. The PCR kinetics in this stage can be described with the following exponential equation describing the log phase:So, the calculation of efficiency for a specific gene is calculated as: Eff=10-1/slope. Literature shows that the incorrect assumption of a 100% PCR efficiency (E=2) strongly confounds accurate calculation of gene-specific relative expression ratios, a 4-fold error leads when the PCR efficiency vary over just a 0.04 range. To calcualte efficiency of each gene, CT tool uses the fluorescence data measured per cycle throughout the amplification process. Linear regression analysis is then used to calculate the intercept and the slope from linearizated fluorescence data. The algorithm implemented to obtein the mean efficiency per gene is based on the LinRegPCR. Concretament, el procés per obtenir l'eficiència consisteix en linearitzar les dades de la fase exponencial de la PCR i determinar la millor regressió lineal. Aquest procés es dur a terme per cada un dels gens i cada mostra, obtenint un resultat específic per cada cas. Els valors finals d'eficiència per gen són el resultat de la mitja dels diferents valors de cada gen. Process of efficiency calculation consist in linearizate the exponencial phase of amplification process and determine the best linear regression. The process is going on for each gene and sample and specific results are obtained per each independent case. Finally, unique efficiency value per gene is obtained using the mean of each gene efficiency information. 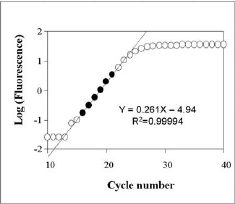
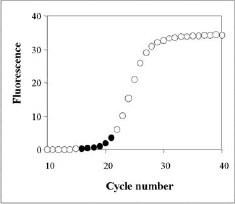
Pictures placed in right part show the program function to obtain the efficiency value. |
||